Appearance
Dashboard
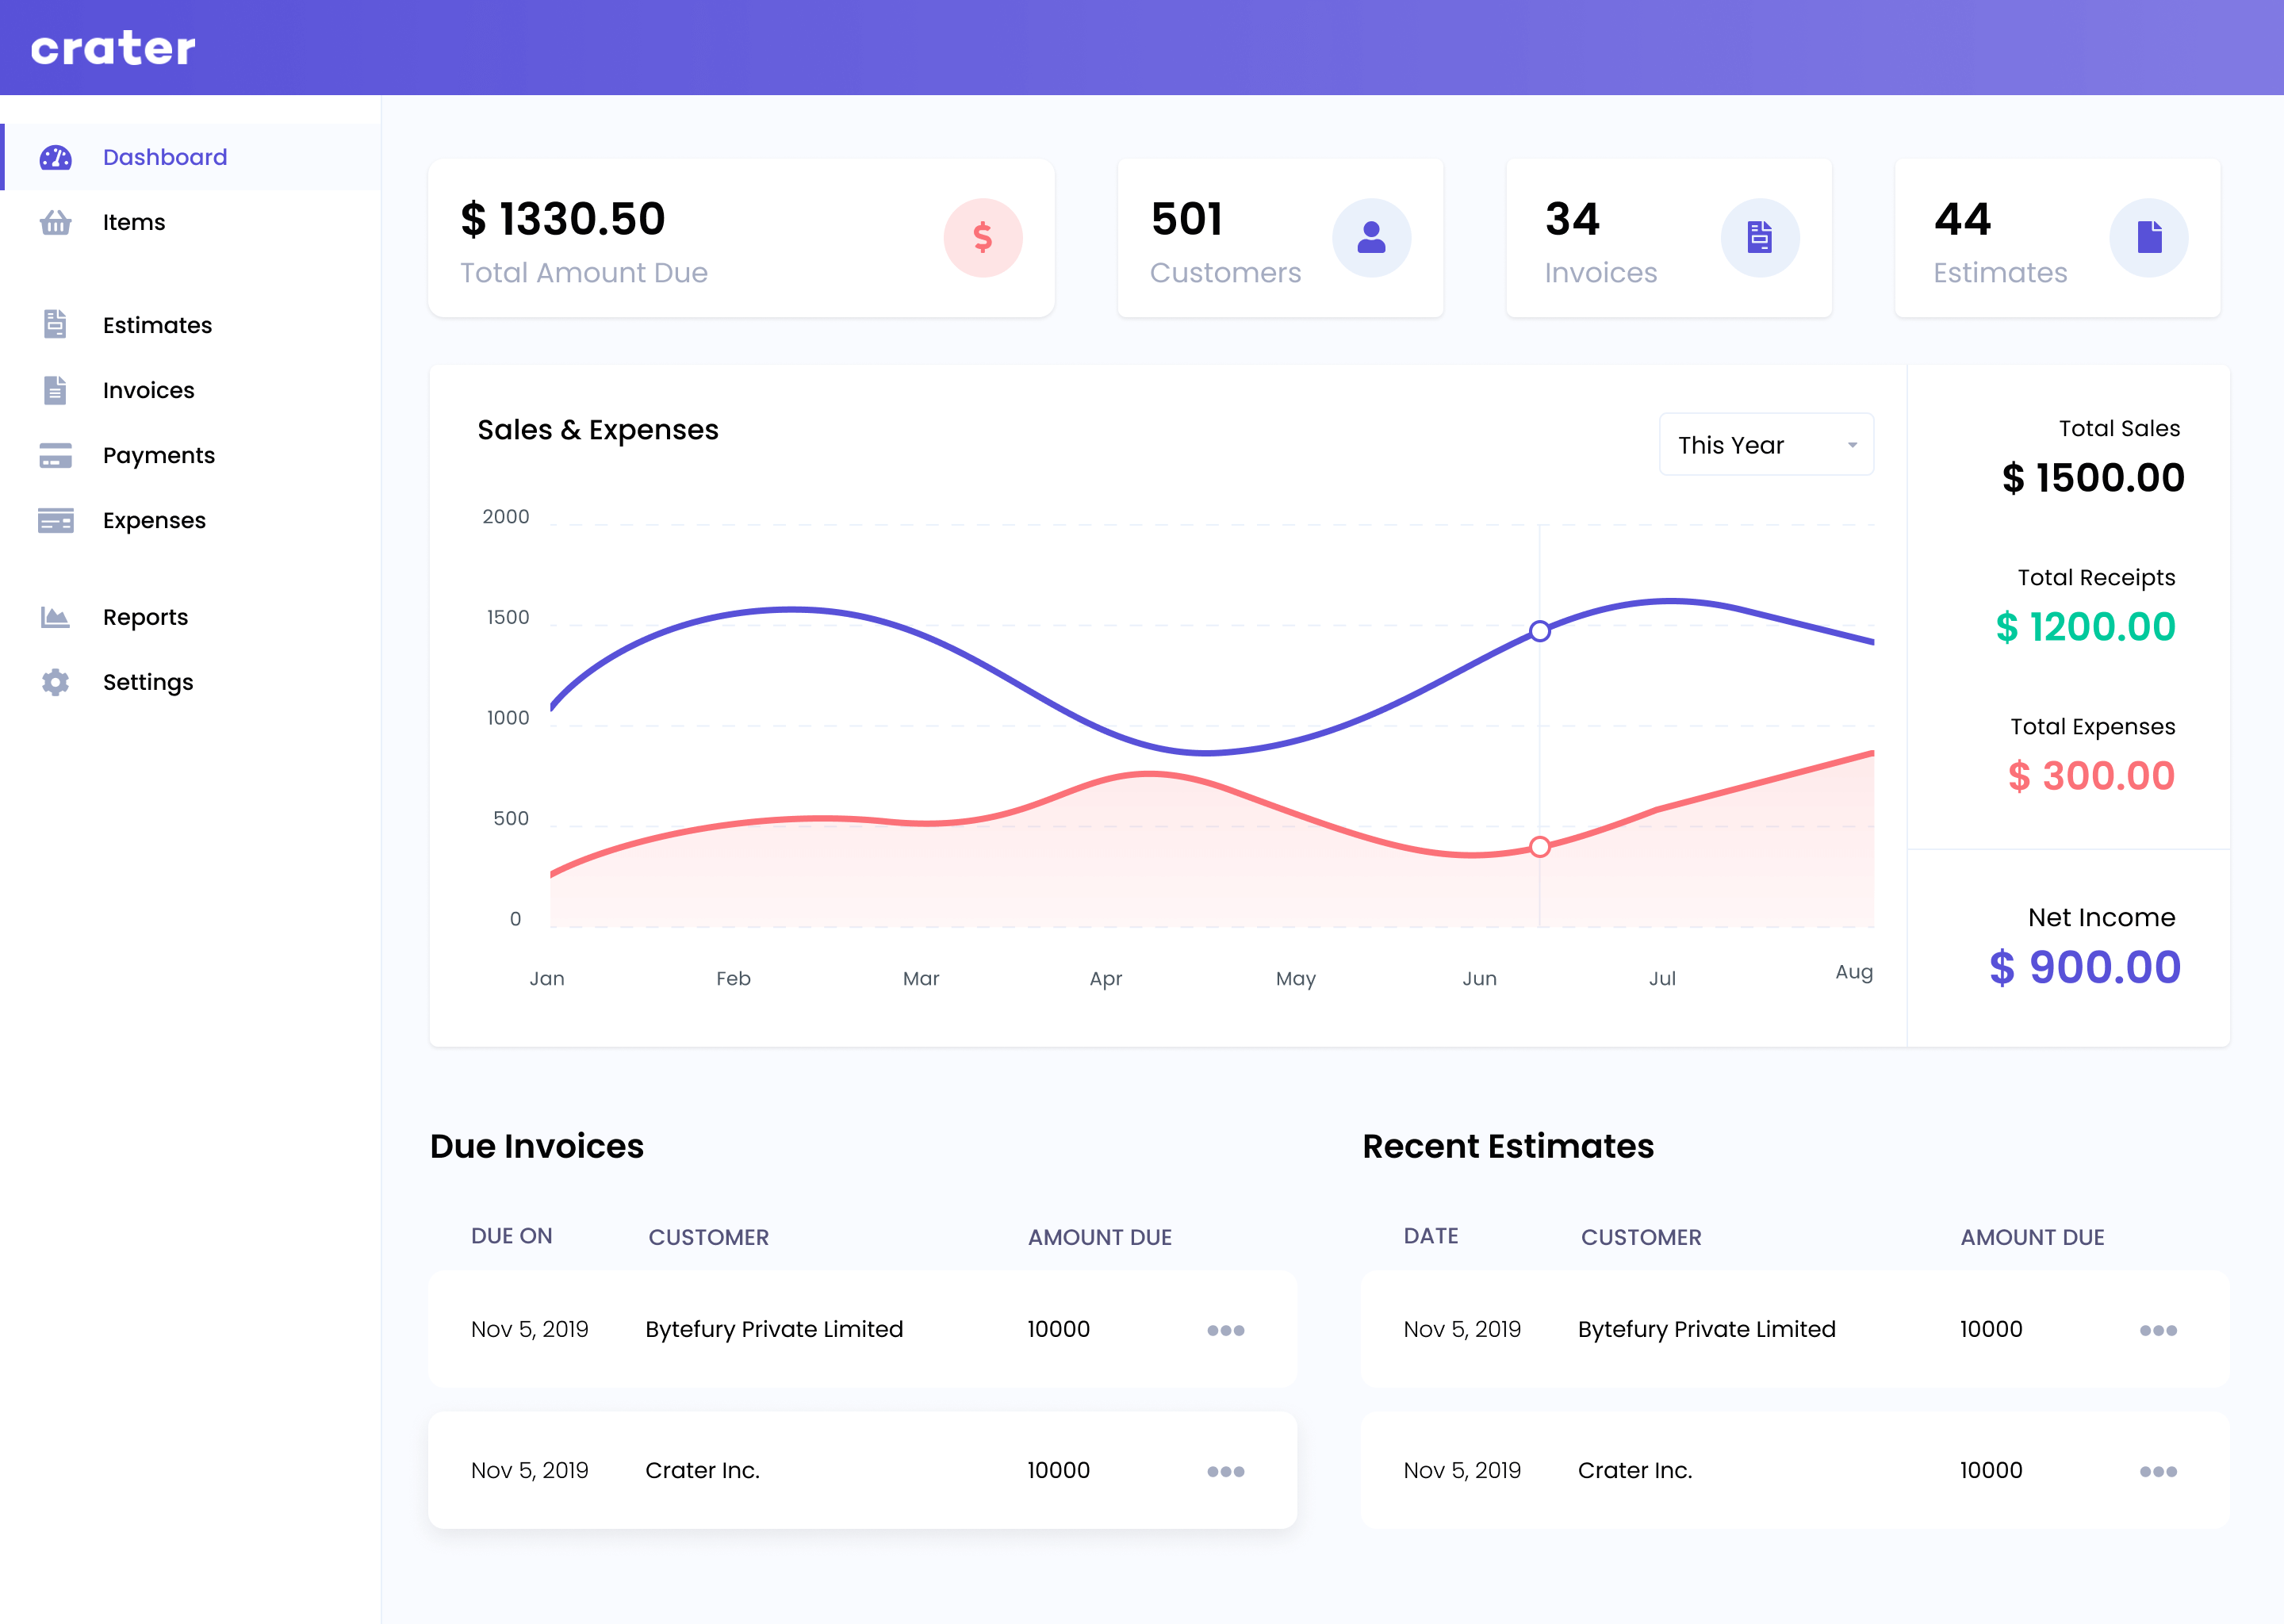
As the name suggests, the dashboard is your primary page which displays the entire overview of the app everytime you login to the app.
You can view the overall, Amount that is due, Your number of customers, Number of invoices generated and number of estimates generated.
The graph below shows sales, receipts, expenses and net income for the particular year and upon hovering on a particular month, you can see the data of that month. You can also select the previous year from the filter tab on the top right corner of the graph. Finally it shows the list of invoices that are due and your most recent estimates.